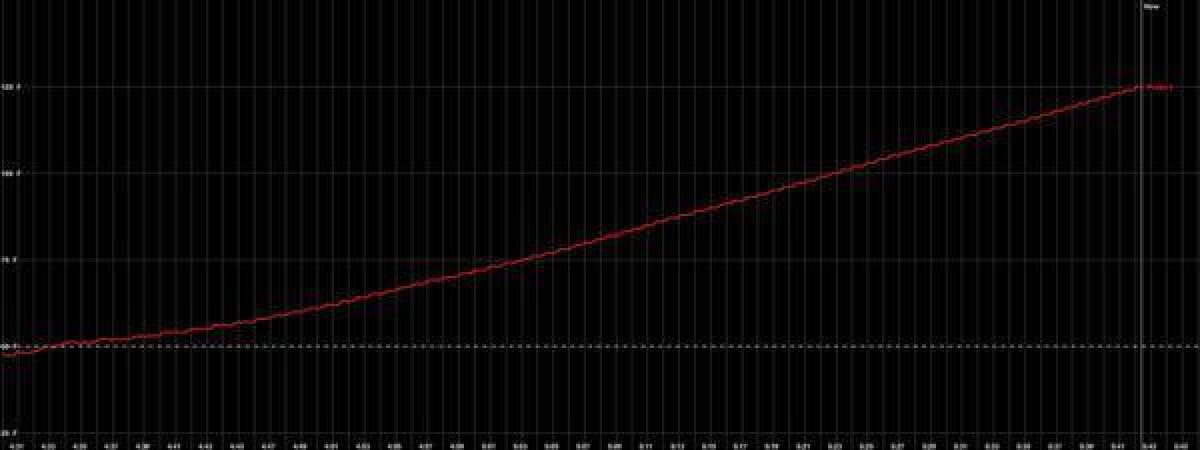
Gadget porn: Check out the graph on that iGrill!

- Share via
Though this Christmas was exceptionally merry (despite an absence of Dungeness crab!), I have to admit that this little graph gave me a real smile. It’s from my favorite new cooking toy, the iGrill, a remote temperature probe that connects to your iPhone.
I’d used it before while smoking turkey breasts, but that was pretty basic -- more in the manner of checking the current temperature and having an alarm alert me when it reached my targeted doneness. As if that wasn’t enough to make a meat geek’s heart flutter!
Christmas Day, I tried another feature -- you can have the iGrill create a time/temperature graph of the meat while it’s cooking! This is what a 2 1/2-pound chunk of dry-aged prime standing rib roast looks like as it works its way to 125 degrees (yeah, I know, but my wife and daughter prefer medium-rare, so we compromised).
It’s a little hard to read reproduced here, but there are a couple of fascinating things about the graph (well, to me, anyway). The first is just how long it took the meat to get to room temperature. I’d pulled it from the refrigerator an hour early, but that still only got it to 50 degrees. It took a full 25 minutes in a 300-degree oven to get to the ambient room temperature of 67 (estimated). Imagine if I’d started cooking straight from the fridge!
The other thing is that the graph is a relatively straight line, no noticeable curve -- and that’s despite the fact that once the roast reached 115 degrees, I cranked the oven up to 550 degrees to brown the surface. Apparently, the 10 minutes at higher heat didn’t penetrate to the center at all.
After a 30-minute rest (which pushed the temperature to about 135), the meat was perfectly done, even from surface to center. It was definitely pink and moist, though the protein was set and firm. To my taste, I would have preferred it about 10 degrees cooler, but on Christmas I’m happy to cook for the other people at the table.
Especially because they had to suffer through me explaining the graph over and over again.
ALSO:
Jonathan Gold quiz: Do you know your gingerbread?
More to Read
Eat your way across L.A.
Get our weekly Tasting Notes newsletter for reviews, news and more.
You may occasionally receive promotional content from the Los Angeles Times.


